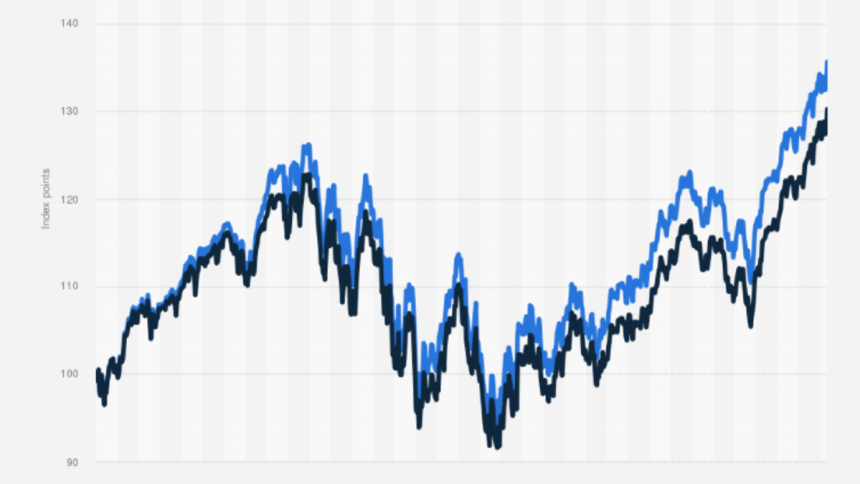
The S&P 500 index stands as a key worldwide market indicator that monitors the business performance of 500 large American companies across different sectors. The right interpretation of S&P 500 chart provides valuable skills which assist traders and investors together with financial enthusiasts in making wiser financial decisions. This extensive guide explores eight fundamental aspects that traders need to analyze in the S&P 500 charts, along with valuable advice that benefits analysts at various skill levels.
1. Understand the Index Construction
Larger firms have a higher impact on the movement of the S&P 500 than do smaller ones since it is weighted by market capitalization, unlike certain other market indexes. The success of mega-cap firms may have a big influence on the index as a whole because of this weighting method. The S&P 500 index displays significant movements which sometimes reflect shifts in powerful companies instead of changes across all market businesses. The variation in structure causes the S&P 500 to generate patterns different from these other indexes like the Dow Jones Industrial Average that employ price weighting.
2. Recognize Meaningful Time Frames
When looking at S&P 500 charts, the time period you choose significantly changes the patterns and inferences you may make. While weekly or monthly charts show longer-term patterns that are important for investors with longer time horizons, daily charts emphasize short-term swings that are useful for active traders. Make sure the time range you have selected fits with your investing objectives before extrapolating any inferences from the chart. While retirement planners gain more from year charts displaying secular patterns, short-term investors may concentrate on hourly or daily changes. The most thorough study sometimes entails looking at several time periods at once in order to comprehend both the current price movement and the larger context in which it takes place.
3. Identify Key Support and Resistance Levels
Support and resistance levels serve as either a floor (support) or a ceiling (resistance) for prices that the S&P 500 has traditionally found difficult to rise above. These technical and psychological obstacles frequently appear near big moving averages, round numbers, or prior notable highs or lows. More buying or selling pressure usually appears as the index gets close to these levels. breaks below support or successful breaks over resistance frequently indicate that the current trend direction will continue. Levels of support or resistance that have been repeatedly tested without being breached are considered particularly powerful. Investors may better predict possible reversal points and choose when to enter and exit positions by keeping an eye on these crucial levels.
4. Track Moving Averages
The calculation of average price across set time durations allows moving averages to simplify price information so traders can discover hidden trends. The research field regarding the S&P 500 frequently draws from three distinct moving averages: 50-day, 100-day, and 200-day averages. The indications help traders detect support levels and resistance points alongside their trend direction. The momentum signals from moving average relationships change when shorter time periods cross above longer time periods (called “golden cross”) or below them (“death cross”). Markets are classified as bull or bear based on observations of the 200-day moving average metric. Market strength and weakness are identified through the connection between present prices and moving averages despite short-term price fluctuations.
5. Monitor Volume Patterns
Trading volume offers vital confirmation of trend strength and possible reversals, as price movements only partially reveal the narrative. While price moves on low volume may suggest less confidence, strong volume typically confirms the seriousness of the shift. While declining volume during price advances may indicate waning momentum, volume usually rises at the start of trends and during breakouts. At significant market-turning events, volume spikes frequently occur to signal euphoria or surrender. Always look at volume indicators in addition to price patterns when examining the S&P 500 live chart in order to determine the amount of involvement. Price-volume differences frequently serve as early warning indicators of possible trend shifts before price action alone might reveal them.
6. Evaluate Market Breadth
Although the S&P 500 index value is an overall number, knowing how many individual stocks are involved in a change offers crucial information about the state of the market. New highs vs new lows, the proportion of stocks trading above important moving averages, and the number of rising versus falling stocks are all measured by breadth indicators. Healthy market rallies usually exhibit widespread involvement from a wide range of equities and industries. This discrepancy may indicate underlying market weakness that is not yet reflected in the index price when the S&P 500 hits new highs and breadth indicators decline. On the other hand, positive reversals are frequently preceded by improving breath during market drops. Compared to index price alone, price charts that incorporate breadth analysis offer a more thorough picture of market circumstances.
7. Consider Economic Context
In addition to technical aspects, S&P 500 charts react to general economic conditions that astute investors monitor in addition to chart trends. GDP growth, employment, inflation, manufacturing, consumer confidence, and Federal Reserve policy choices are important economic indicators. Important index fluctuations that produce technical patterns on charts are often triggered by major economic announcements. Accurately interpreting chart formations requires knowledge of how particular economic releases have affected market behavior in the past. Traditional technical analysis can occasionally become less accurate during times of economic upheaval as markets adapt to new underlying realities. Understanding the underlying economic climate that influences investor mood and business performance is a necessary component of even the most advanced chart analysis.
8. Recognize Sentiment Extremes
The market psychology of investors as a whole usually achieves extreme levels before major trend modifications occur. Sentiment measures including VIX (volatility index), put-call ratios and various investor survey results function as indicators for potential market trend shifts when optimistic or pessimistic investor sentiment becomes unmanageable. For vigilant investors, contrarian possibilities arise when excessive bullishness regularly comes around market peaks and extreme bearishness usually emerges near bottoms. The weariness of the dominant trend is sometimes indicated by chart patterns created during emotion extremes. Divergences between sentiment indicators and price movement—when prices hit new lows in the face of improving sentiment or new highs in the face of declining sentiment—are especially valuable. Significant market reversals that show up on S&P 500 charts are often preceded by these disparities.
Conclusion
Understanding index construction, choosing the right time frame, identifying levels of support and resistance, moving average analysis, volume interpretation, breadth assessment, economic context, and sentiment evaluation are all necessary for an effective analysis of the S&P 500 chart today. By including these eight essential components in your analytical procedure, you 0will gain a more thorough comprehension of how market movements are represented in S&P 500 charts.
Lynn Martelli is an editor at Readability. She received her MFA in Creative Writing from Antioch University and has worked as an editor for over 10 years. Lynn has edited a wide variety of books, including fiction, non-fiction, memoirs, and more. In her free time, Lynn enjoys reading, writing, and spending time with her family and friends.


