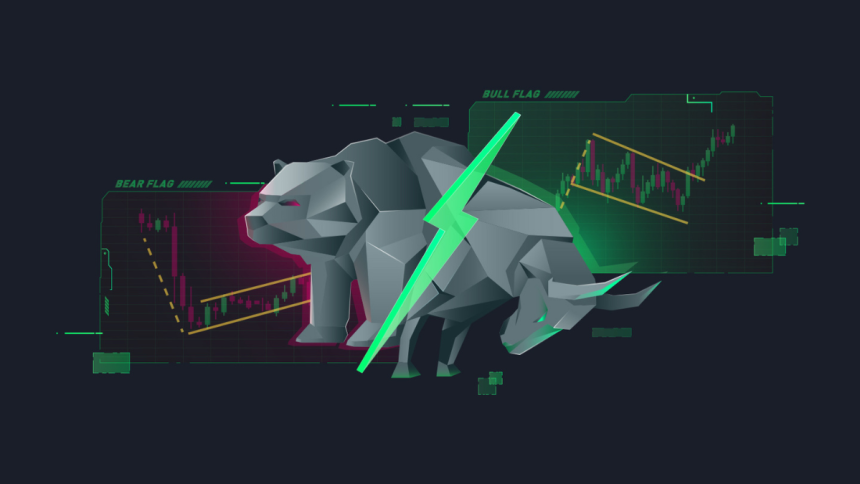
Trading isn’t just about chasing green candles and hoping for the best. It’s about reading the market’s mood, understanding its language, and reacting strategically. In my early days, I was often swept away by excitement, jumping into trades without recognizing the subtle signs a chart reveals. One of the most eye-opening discoveries I made was how certain formations—like the bear flag pattern—can quietly hint at continuation before a major move. Once I learned to spot it, everything changed
Today, I want to share a powerful continuation setup that helped me stop chasing trades and start leading them. Recognizing this pattern early changed how I approached short-side setups, especially when the market was falling apart. If you’re a beginner who’s tired of late entries or feeling lost during market pullbacks, this strategy might be what you need.
Why Continuation Patterns Matter
When the market makes a strong move in one direction, it rarely does so in a straight line. It breathes. It surges, pauses, and then either continues or reverses. These pauses often form recognizable formations—visual footprints of traders’ psychology.
Understanding continuation patterns allows you to:
- Time entries with better precision
- Reduce risk by placing stops in logical areas
- Avoid getting trapped in fakeouts
- Ride the momentum instead of reacting to it
I remember being on the wrong side of trades simply because I didn’t grasp the importance of when a move paused and how it behaved during that pause. Once I started studying these formations more deeply, everything changed.
The Anatomy Of A Trend Pause
Let’s take a step back.
Imagine you’re watching a stock that just dropped sharply on high volume. Most traders panic or chase short entries too late. Smart money, however, waits. They anticipate a reaction—a pause in selling, maybe a small rebound, a moment for the chart to digest the move.
This consolidation often looks like a small upward slant in price within a larger downtrend. It tempts bullish traders into thinking a reversal is coming. But it’s a setup. This pattern traps long entries and fuels the next leg down once it breaks.
The psychological game here is fascinating. Sellers lighten up. Buyers get hopeful. Volume fades. It’s calm before the next storm. Once that calm is broken—boom. Price dumps again.
Recognizing The Setup In Real-Time
Here’s how I learned to catch this continuation setup before it unfolds:
1. Identify A Strong Downward Move
Look for a sharp drop on above-average volume. This is the emotional part of the move—where panic, news, or momentum creates a strong push downward.
2. Wait For A Tight Pullback
Don’t rush. A disciplined trader watches the chart tighten into a shallow pullback, often forming a small channel or rising wedge. Price starts making higher lows and higher highs but in a weak, drifting manner. Volume dries up. That’s the key clue: interest is fading.
3. Use The Parallel Channel Trick
Here’s what helped me the most—drawing a parallel channel around the pullback. When price hugs the upper boundary of the channel and volume is low, I get ready. As soon as it breaks below the lower trendline, I look for an entry, often adding confirmation from indicators like RSI or MACD divergence.
4. Execute The Trade
I set a stop above the recent high of the channel and aim for at least 2:1 reward-to-risk. Most of the time, the move down is sharp, especially if the broader trend supports it.
Life Experience: The Setup That Changed My Game
Back in 2021, during a turbulent week in the tech sector, I was eyeing a mid-cap stock that had just tanked 12% on earnings. The chart screamed exhaustion. But then something interesting happened—it started to climb slowly over the next two days. Volume was dropping, and the price movement felt “forced.” It wasn’t organic buying. It felt… staged.
I drew my channel, watched the support line, and waited. On day three, it cracked with a vengeance. I entered short, and within hours the price fell another 10%. That one setup, done right, paid for a whole week’s worth of losses. More importantly, it gave me the confidence to trust the process—something the Elliott Wave Course had been drilling into me: patience, structure, and seeing the bigger picture.
Key Traits To Watch For
- Volume behavior: Heavy on the initial move, light during consolidation
- Pattern slope: Slight upward or flat during the pullback
- Time factor: Often forms within 3–7 sessions after the sharp drop
- Break trigger: Exit from the lower boundary with increasing volume
Conclusion
Learning to read chart setups before they unfold is like learning to read people’s expressions before they speak. You become proactive instead of reactive. That single shift in mindset took me from erratic to consistent in my trading journey—and it’s the kind of perspective we emphasize at Alchemy Markets.
This particular pattern isn’t flashy. It doesn’t scream for attention. But it rewards patience, observation, and precision—three traits every successful trader must develop.
So the next time you see price drifting upward after a big sell-off, zoom in. Draw your lines. Watch volume. And prepare. Because when the trap is set and the break comes, you’ll be ready—not surprised.
FAQs
What Timeframe Is Best For Spotting This Setup?
The pattern shows up well on the 1-hour and 4-hour charts for swing trades, and on the daily chart for larger moves. Intraday traders also use the 5-min or 15-min chart for scalping.
Can I Use Indicators To Confirm It?
Yes. RSI showing weakness during the pullback, MACD histogram fading, or moving averages flattening can all add confidence to the setup.
Is It Reliable In All Markets?
It performs best in trending markets—especially bearish ones. During choppy or range-bound periods, it loses reliability. Always check the broader context.
How Do I Manage Risk?
Place your stop just above the recent high of the pullback channel. Your first target could be the previous low, and your second target 1.5x or 2x that range.
Lynn Martelli is an editor at Readability. She received her MFA in Creative Writing from Antioch University and has worked as an editor for over 10 years. Lynn has edited a wide variety of books, including fiction, non-fiction, memoirs, and more. In her free time, Lynn enjoys reading, writing, and spending time with her family and friends.